Normal Distribution Tutorial Sheet, #16
Learning Outcomes
- Use the general normal distribution equation to determine probabilities
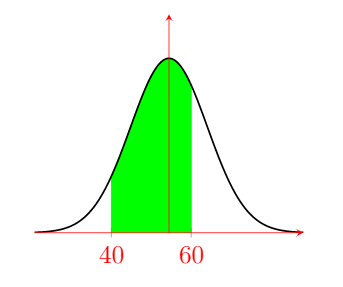
- Sketch bell-curves noting standard deviations
- Use probabilities to determine standard deviation and mean
Additional Resources
Tutorials
- Gaussian : Extra video by Sam recapping the Gaussian from the lecture.
- Summary Sheet : An summary sheet of all we learnt. However remember we can use technology!
Software
- WolframAlpha : A nifty probability calculator with visualisations on the graph itself.
Problem sheet
Skill Building Questions
Problem 1.
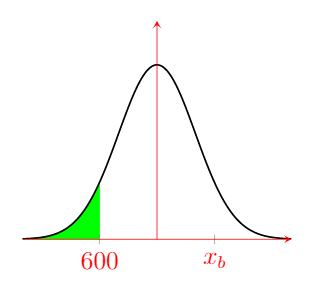
Alex took a test and scored 940. The mean score was 850 with the standard deviation of 100.
(a) Draw a Gaussian/Bell Curve for this Data and highlight area higher than Alex’s score. Include all given information on the diagram.
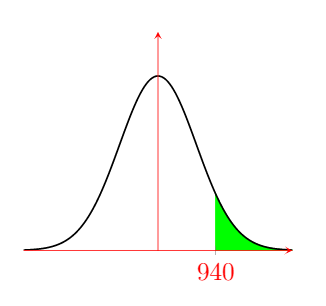
(b) If there were a total of 200 students taking the test, how many would be expected to get a higher mark than Alex?
$\Rightarrow{} P(X>940)=1-0.81594=0.18406$ %
$\Rightarrow{} 0.18406\times 200=36.81$ students
$\Rightarrow{}$ rounding down: $\boxed{\text{ only 36 students are expected to be higher }}$
(c) If the failing mark for this test was 600, how many of the 200 students would be expected to failed the test? Show this on your diagram
$ \Rightarrow{} P(X < 600)=0.006=0.6\% $
$ \Rightarrow{} \boxed{ 1 \text{ Student} }$
Problem 2.
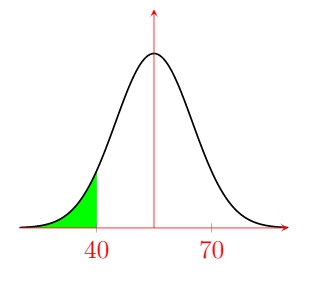
According to a survey from 100 undergraduate students, only 5 students were graduated with a grade above 70%. If the average student grade was 55%:
(a) Draw a Gaussian/Bell Curve for the given Data.
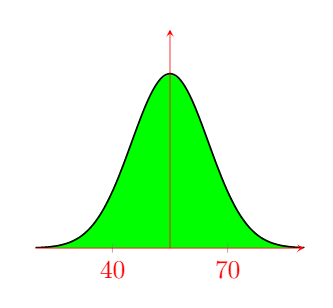
(b) Using the given data, find the standard deviation for the graduation grades.
$ \Rightarrow{} P(X>70)={0.5{ \text{ erf }{(\frac{\ 70\ -\ 55}{\sigma\ \sqrt{2}})}}}=0.45 $
$ \Rightarrow{} \text{erf }(x) =0.9 $
$ \Rightarrow{} x =$ $ 1.16308 $
$ \Rightarrow{} 1.16={\frac{\ 70\ -\ 55}{\sigma\ \sqrt{2}}}$
$ \Rightarrow{} \boxed{ SD = \sigma =9.12}$
(c) If the failing grade is to be 40%, how many students would possibly fail the course? Show this on the diagram as well.
$\Rightarrow{} \boxed{ 5 \text{ Students}}$
(d) How many students would be expected to pass the course below 60%? Add this to your diagram.
$ \Rightarrow{} P(40 < X < 60)= \frac{1}{2}\left[\text{ erf}\left(\frac{60-55}{8.64\ \sqrt{2}}\right)- \text{ erf}\left(\frac{40-55}{8.64\ \sqrt{2}}\right)\right] $
$ \Rightarrow{} P(40 < X < 60)=0.678=68 \% $
$ \Rightarrow{} \boxed{68\ \text{ Students}}$
Problem 3.
A Packing plant fills bags with cement. The mean weight of these bags is 50kg with standard deviation of 4kg.
(a) Draw a Gaussian/Bell Curve for the given Data.
(b) Find the probability of bags exceeding 53kg.
$ \Rightarrow{} \boxed{ P(X>53)= 0.23=23 \\ }$
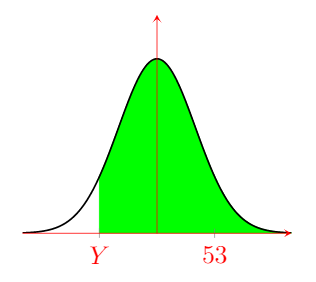
(c) Find the weight that is exceeded by 82% of the bags.
$ \Rightarrow{} P(X>Y)=0.32={ {-\frac{1}{2}}{\text{ erf}(x)}} $
$ \Rightarrow{} x =$ $-0.65$
$ \Rightarrow{} -0.65={(\frac{\ Y\ -\ 50}{\ 4\ \sqrt{2}})}$
$ \Rightarrow{} Y = $ $ 46.32 $
$ \Rightarrow{} \boxed{ \text{ Weight } =46.32 }$
(d) Three bags were randomly selected. Find the probability that two bags weigh more than 53kg and one weighs less than 53kg.
There are three possible combinations when selecting the bags so you must account for all of them: $\Rightarrow{} \text{ Probability } =P ( X>53)\times\ P(X>53)\times\ P(X<53)= 0.23\times\ 0.23\times\ 0.77 = 0.04$
$\Rightarrow{} \text{ Probability } =P ( X>53)\times\ P(X<53)\times\ P(X<53) = 0.23\times\ 0.23\times\ 0.77- = 0.04$
$\Rightarrow{} \text{ Probability } =P ( X<53)\times\ P(X>53)\times\ P(X>53)= 0.23\times\ 0.23\times\ 0.77 = 0.04$
$\Rightarrow{} \boxed{ \text{Added Probability} =0.04 + 0.04 + 0.04 = 0.12 = 12 \% }$
Problem 4.
A high-Jumper can clear a jump higher than 1.78m once in every five attempts. This jumper can also clear a height of at least 1.65m on 7 out of 10 attempts:
(a) Draw a Gaussian/Bell Curve for the given Data with highlighting the jumps over 1.78.
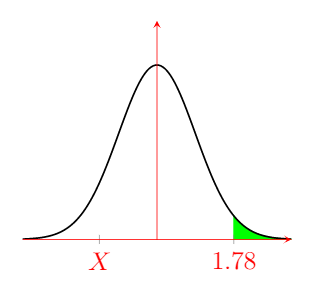
(b) Find the mean and the standard deviation of the heights the athlete can reach.
$ \Rightarrow{} 2(1-0.2)-1 = \text{ erf} \ {(\frac{\ 1.78\ -\ \alpha}{\sigma\ \sqrt{2}})} = 0.6$
$ \Rightarrow{} \text{erf }(x) = 0.6 \Rightarrow{} x = $ $ 0.60$
$ \Rightarrow{} x=0.6={(\frac{\ 1.78\ -\sigma}{\alpha\ \sqrt{2}})}$
$ \Rightarrow{} \alpha={ {(1.78)}-{(\sigma\times\ 0.6\times\ \sqrt{2})}}$
Also, $ \Rightarrow{} \text{ } P(X>1.65)={1-[\frac{1}{2}{({1{+{ \text{ erf}\ {(\frac{\ 1.65\ -\ \alpha}{\sigma\ \sqrt{2}})}}}})}]}=70\%$
$ \Rightarrow{} 2(1-0.7)-1 = \text{ erf} \ {(\frac{\ 1.78\ -\ \alpha}{\sigma\ \sqrt{2}})} = -0.4$
$ \Rightarrow{} \text{erf }(x) = -0.4 \Rightarrow{} x = $ $ -0.37$
$ \Rightarrow{} \alpha={ {(1.65)}-{(\sigma\times\ (-0.37)\times\ \sqrt{2})}}$
$ \Rightarrow{} { {(1.78)}-{(\sigma\times\ 0.6\times\ \sqrt{2})}}={ {(1.65)}-{(\sigma\times\ (-0.37)\times\ \sqrt{2})}}$
$ \Rightarrow{} 1.78-1.65={(\sigma\times\ \sqrt{2})\times\ {(0.37+0.6)}}$
$ \Rightarrow{} \boxed{ \sigma = \frac{0.13}{\sqrt{2}\times\ 0.97}=0.09m }$
$ \Rightarrow{} \alpha={ {(1.78)}-{(0.09\times\ 0.6\times\ \sqrt{2})}}$
$ \Rightarrow{} \boxed{ \alpha=1.7m }$
Exam Questions
Problem 5.
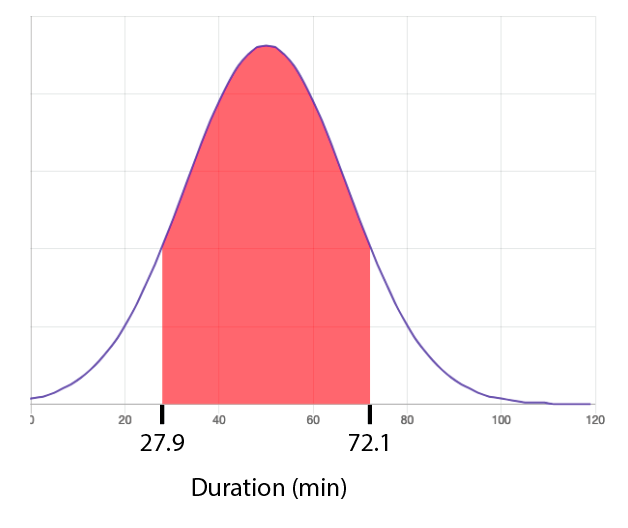
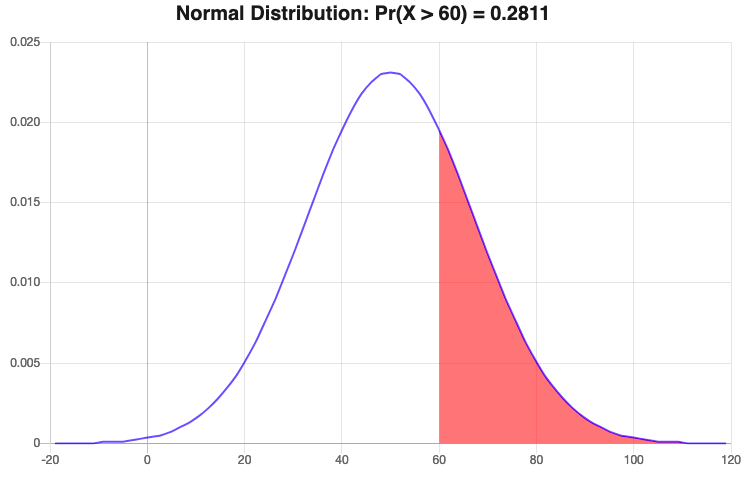
Due to imperfect manufacturing of circuit laundry machines, their wash times can vary. The machine displays a time of 50 minutes for colors at $40 ^\circ $ but truly has a standard deviation of 17 minutes and 15 seconds around that time.
(a) Sketch a graph of the wash time for colors at $40 ^\circ $ distribution. Shade the region showing the 80% most reliable wash times and label the duration interval.
(b) If Imperial College London buys an army of 12 laundry machines for the entirety of Southside Halls and its 350 students, how many of the machines can be expected to have a wash time of more than 60 minutes?
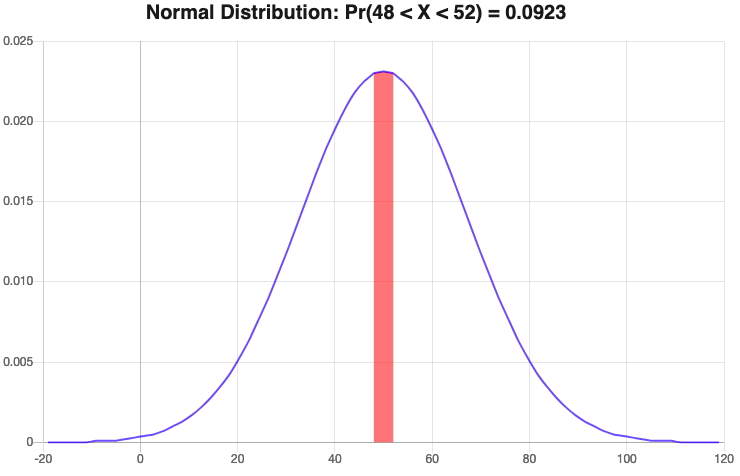
(c) How many of the machines are expected to have a $\pm2$ min accuracy with their colors at $40 ^\circ $ cycles?
$ \Rightarrow{} P(48 < X < 52)= \frac{1}{2}\left[\text{ erf}\left(\frac{52-50}{17.25\ \sqrt{2}}\right)- \text{ erf}\left(\frac{48-50}{17.25\ \sqrt{2}}\right)\right] $
$ \Rightarrow{} P(48 < X < 52)=0.0923$
$\Rightarrow{}0.0923*12 = 1.1076$ $ \Rightarrow{} \boxed{1\ \text{ machine}}$
This particular tutorial sheet was short. Do not be alarmed! It reflects the low difficulty of the topic.
Answers
For Printing
Revision Questions
The questions included are optional, but here if you want some extra practice.
- Engineering Mathematics 7th edition, Stroud and Dexter : Pages 1106-1116
- Advanced Engineering Mathematics 5th edition, Stroud and Dexter : Pages 755-758
- Easy Questions : A set of quite easy A-Level questions.
- More Easy Questions : More A-Level questions, you can use these for ‘learning by rote’.